The 2018 Midterm Elections, by the Numbers
These numbers prove that the enthusiasm around female candidates is very real. You've probably heard that more women than ever before are running for Congress, but records are being set at the state level. That’s just one of many milestones to come out of this race.
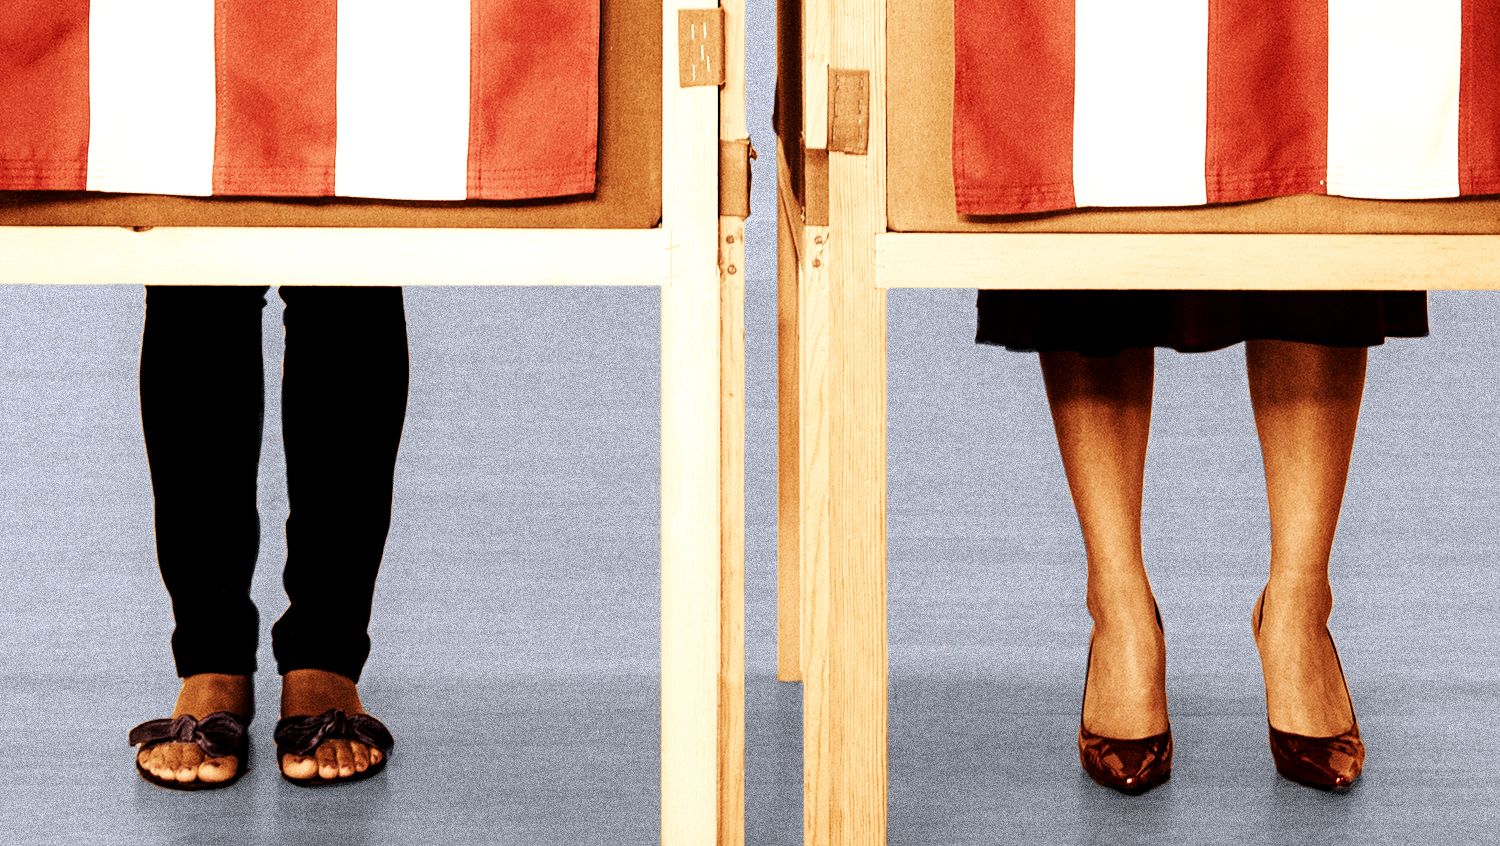

Call it the year of the woman or the pink wave—either way, the 2018 midterm elections have garnered far more attention and excitement than the ho-hum, low voter turnout contests of years past. There are an historic number of women running for office, campaign spending is on pace to make this the most expensive midterms ever, and a record-setting 800,000 people signed up to vote on National Voter Registration Day earlier this month (thank you, Taylor Swift!).
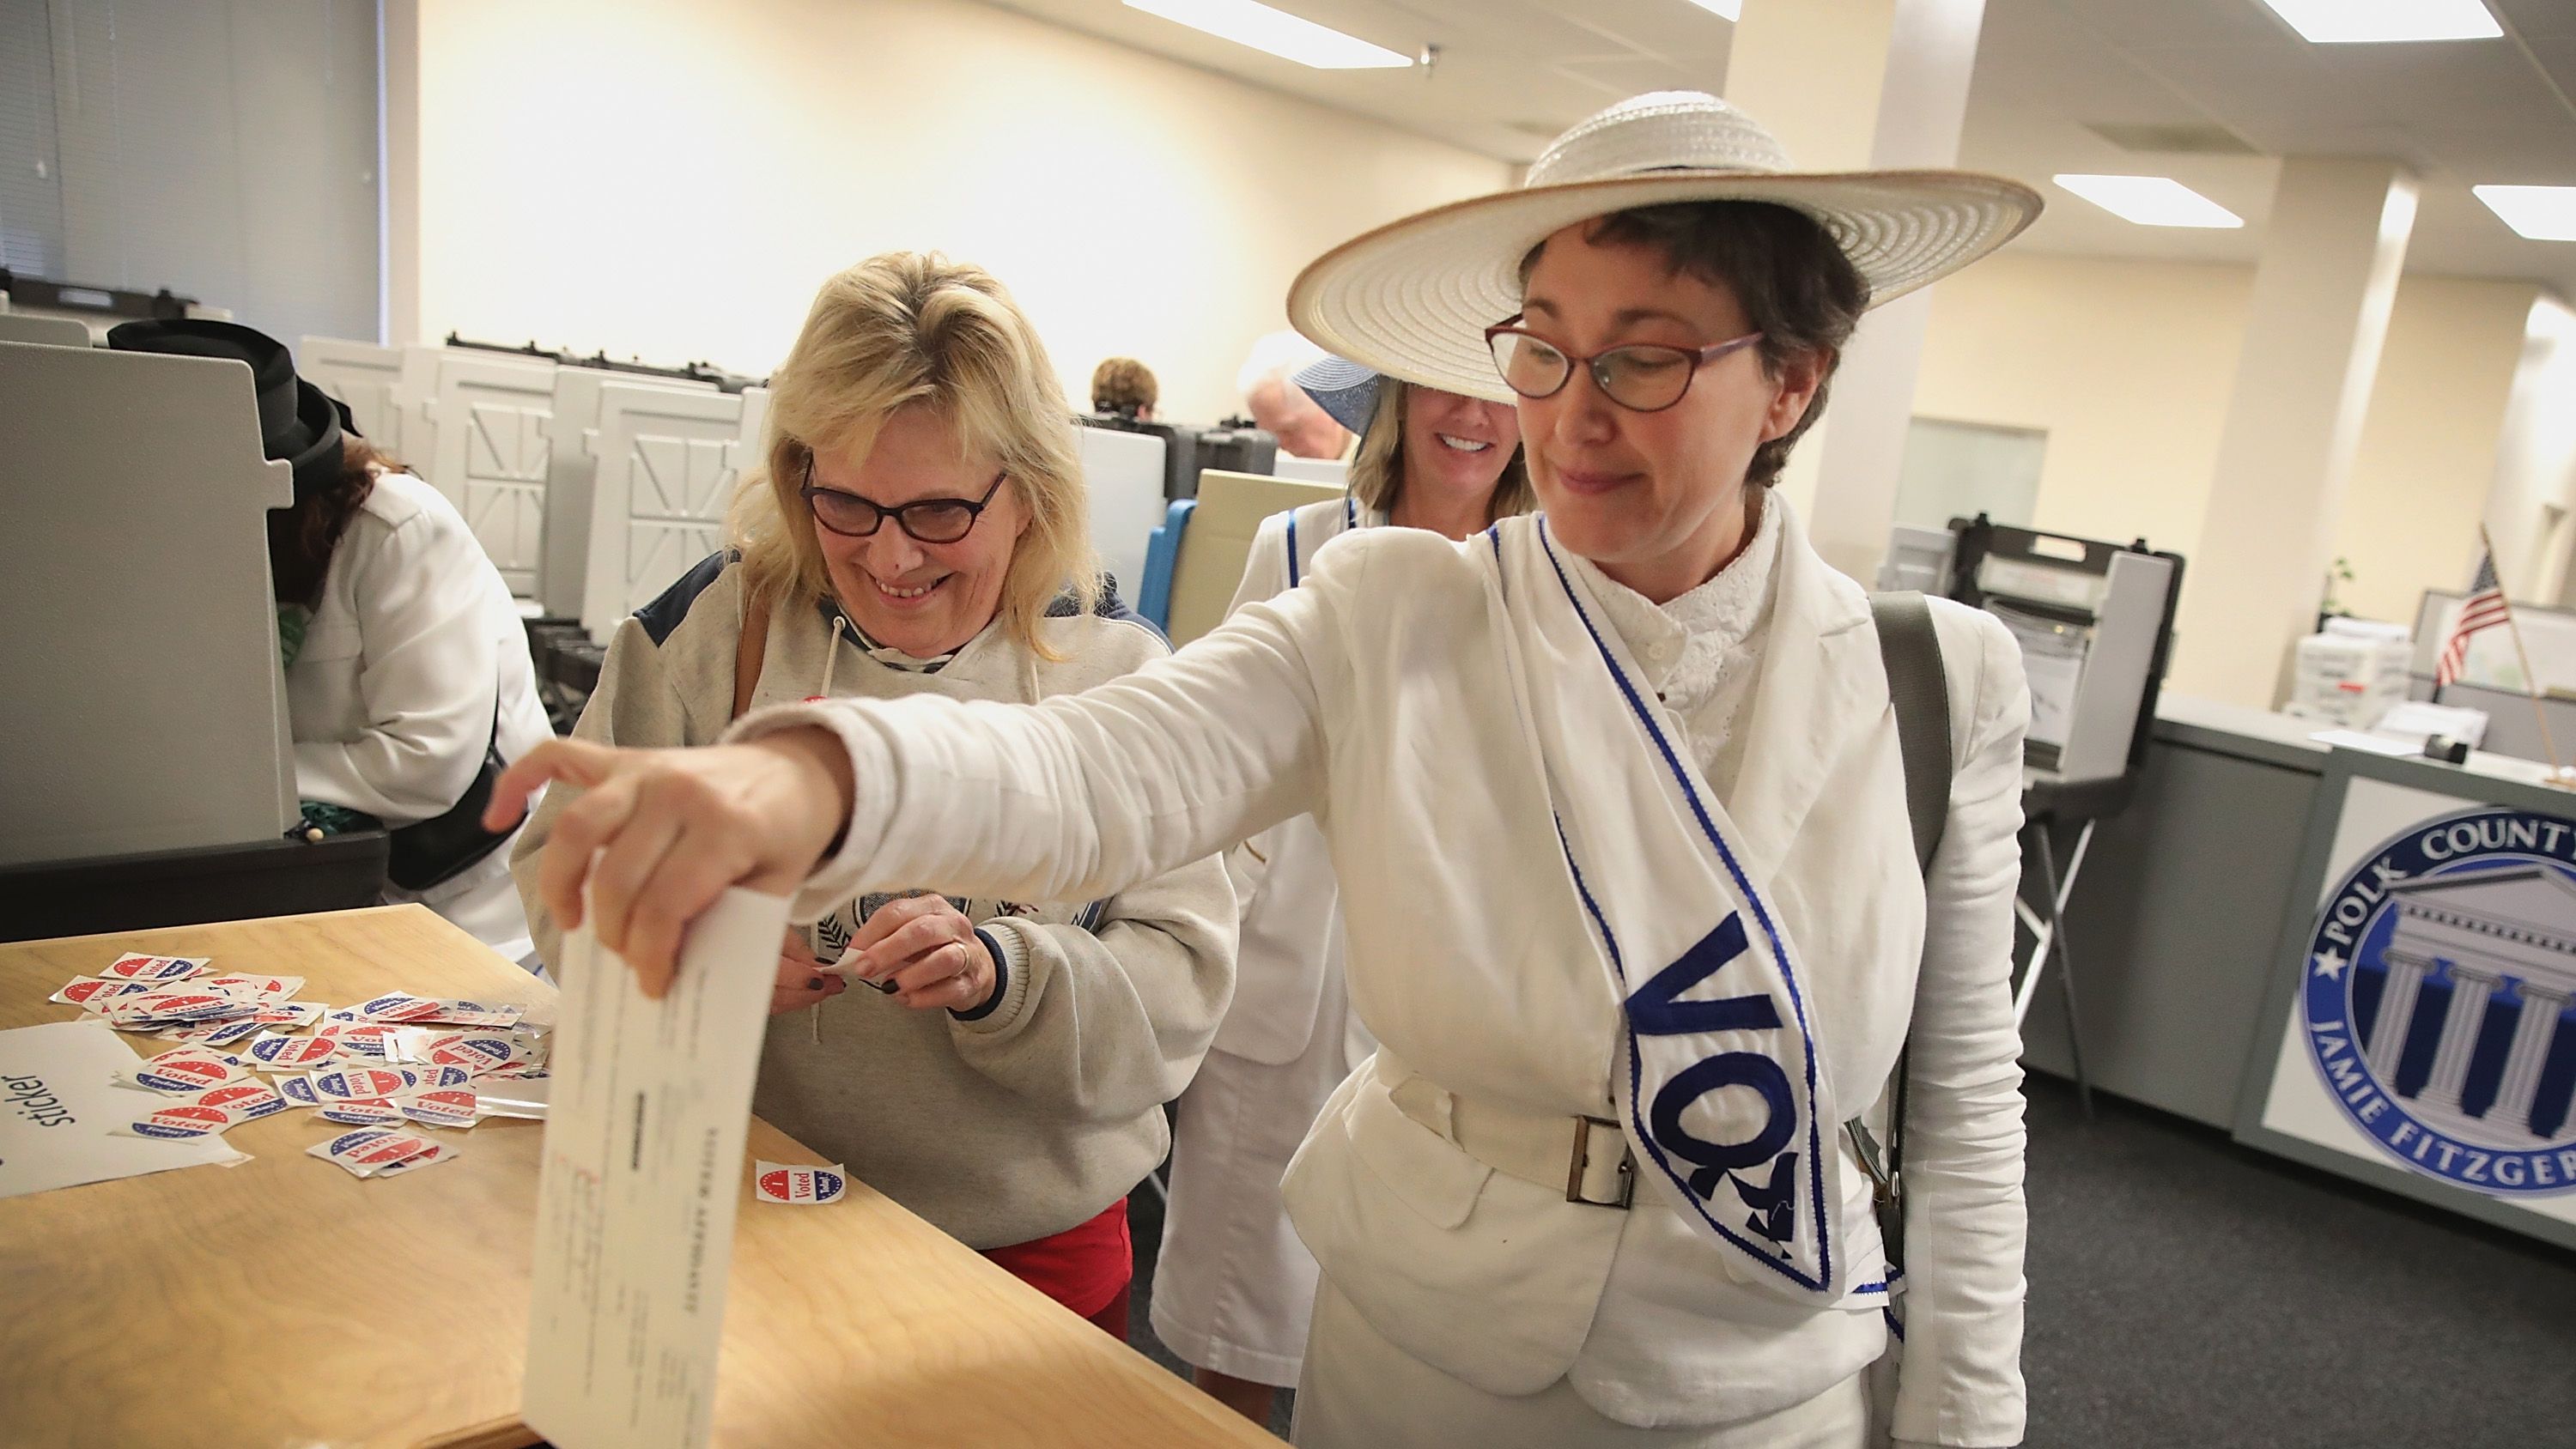
With just hours to go until the polls close, voters are already reporting long lines, and nonprofits like Pizza to the Polls have sprung into action to make sure that everybody waiting is well-fed. There's a lot at stake during this election—from the health of Roe v. Wade and how things will shake out if it's overturned, to the legislation seeking to kill an anti-discrimination law and leave trans people in danger in public spaces. Long before polling places opened, celebrities and other public figures were already speaking out about who they were endorsing and urging others to vote—after all, today marks the first real electoral test of the strength of the "resistance."
And yet. With a dizzying amount of midterms coverage making the rounds on TV and social media every day, it can be hard to make sense of it all, even for the most impassioned of us. We hear you, and that’s why we’ve prepared this list of straight facts and figures on the key takeaways from the campaign season.
These numbers prove that the enthusiasm around female candidates is very real—you’ve probably heard that more women than ever before are running for Congress, but records are being set at the state level, too, where 3,379 women are running for seats in their state legislatures (that’s an increase of more than 700 women from 2016) and a history-making 16 women have been nominated for governor.
That’s just one of many milestones to come out of this race. Like...
529 vs. 312
Number of women running for Congress in 2018 vs. 2016.
235 vs. 167
Number of female nominees for the U.S. House in 2018 vs. in 2016 (the previous record).
Get exclusive access to fashion and beauty trends, hot-off-the-press celebrity news, and more.
22 vs. 18
Number of female nominees for the U.S. Senate in 2018 vs. 2012 (the previous record).
476 vs. 298
Number of women who filed to run for the U.S. House in 2018 vs. 2012 (the previous record).
53 vs. 40
Number of women who filed to run for the U.S. Senate in 2018 vs. 2016 (the previous record).
61 vs. 34
Number of women who filed to run for governor in 2018 vs. 1994 (the previous record).
44 percent
Increase in female Congressional candidates since 2012.
75 percent
Increase in women of color candidates for Congress since 2012.
13 percent
Decrease in white male candidates for Congress since 2012.
44 percent vs. 76 percent
The portion of white men who make up Democratic candidates for state legislature vs. the portion of white men who make up Republican candidates for state legislature.
RELATED STORY

71 percent
Increase in women of color candidates for state legislatures since 2012.
102
Number of women running for governor, U.S. House, or U.S. Senate who are first-time candidates.
42,000 vs. 920
Number of women who contacted EMILY’s List, an organization that helps pro-choice Democratic women run for office, to express interest in running for office since the 2016 election vs. the previous record number of women who contact the group during the entire 2016 election cycle.
22
Number of female nominees for U.S. Senate, a record. Of those, 15 are Democrats and 7 are Republicans.
235
Number of female nominees for U.S. Congress, a record. Of those, 183 are Democrats and 52 are Republicans.
32.4 percent
Portion of all major-party nominees for U.S. Senate that are women.
28.7 percent
Portion of all major-party nominees for U.S. House that are women.
50 percent
Portion of female nominees for the U.S. House who are challenging incumbents.
34 percent
Portion of female nominees for the U.S. House who are women of color.
17.4 percent
Portion of female nominees for the U.S. House who identify as black.
8.1 percent
Portion of female nominees for the U.S. House who identify as Latina.
6.8 percent
Portion of female nominees for the U.S. House who identify as Asian/Pacific Islander.
0.9 percent
Portion of female nominees for the U.S. House who identify as Native American
1
.
Number of female nominees for the U.S. Senate who are women of color.
244
Number of openly LGBTQ candidates who will appear on general election ballots.
21
Number of openly LGBTQ candidates who won Democratic primaries for U.S. Senate or House; there are zero known LGBTQ Republican nominees for U.S. Congress for the first time since 2010.
RELATED STORY
4
Number of LBGTQ nominees for governor, a record.
35
The number of seats up for election in the U.S. Senate in 2018.
26 vs. 9
Number of Democratic-held seats in the U.S. Senate that are up for election in 2018 vs. the number of Republican-held seats in the U.S. Senate that are up for election in 2018 .
10
Number of U.S. Senate held by Democrats in states President Donald Trump won in 2016 that are up for election in 2018.
2
Number of seats Democrats need to net to take control of the U.S. Senate (while holding on to the 49 seats they currently have).
435
The number of seats up for election in the U.S. House in 2018.
23
Number of Republican-held seats Democrats need to win to take control of the U.S. House.
68
Number of U.S. House districts that are considered competitive.
16 percent
Portion of Americans living in one of the U.S. House districts that are considered competitive.
11
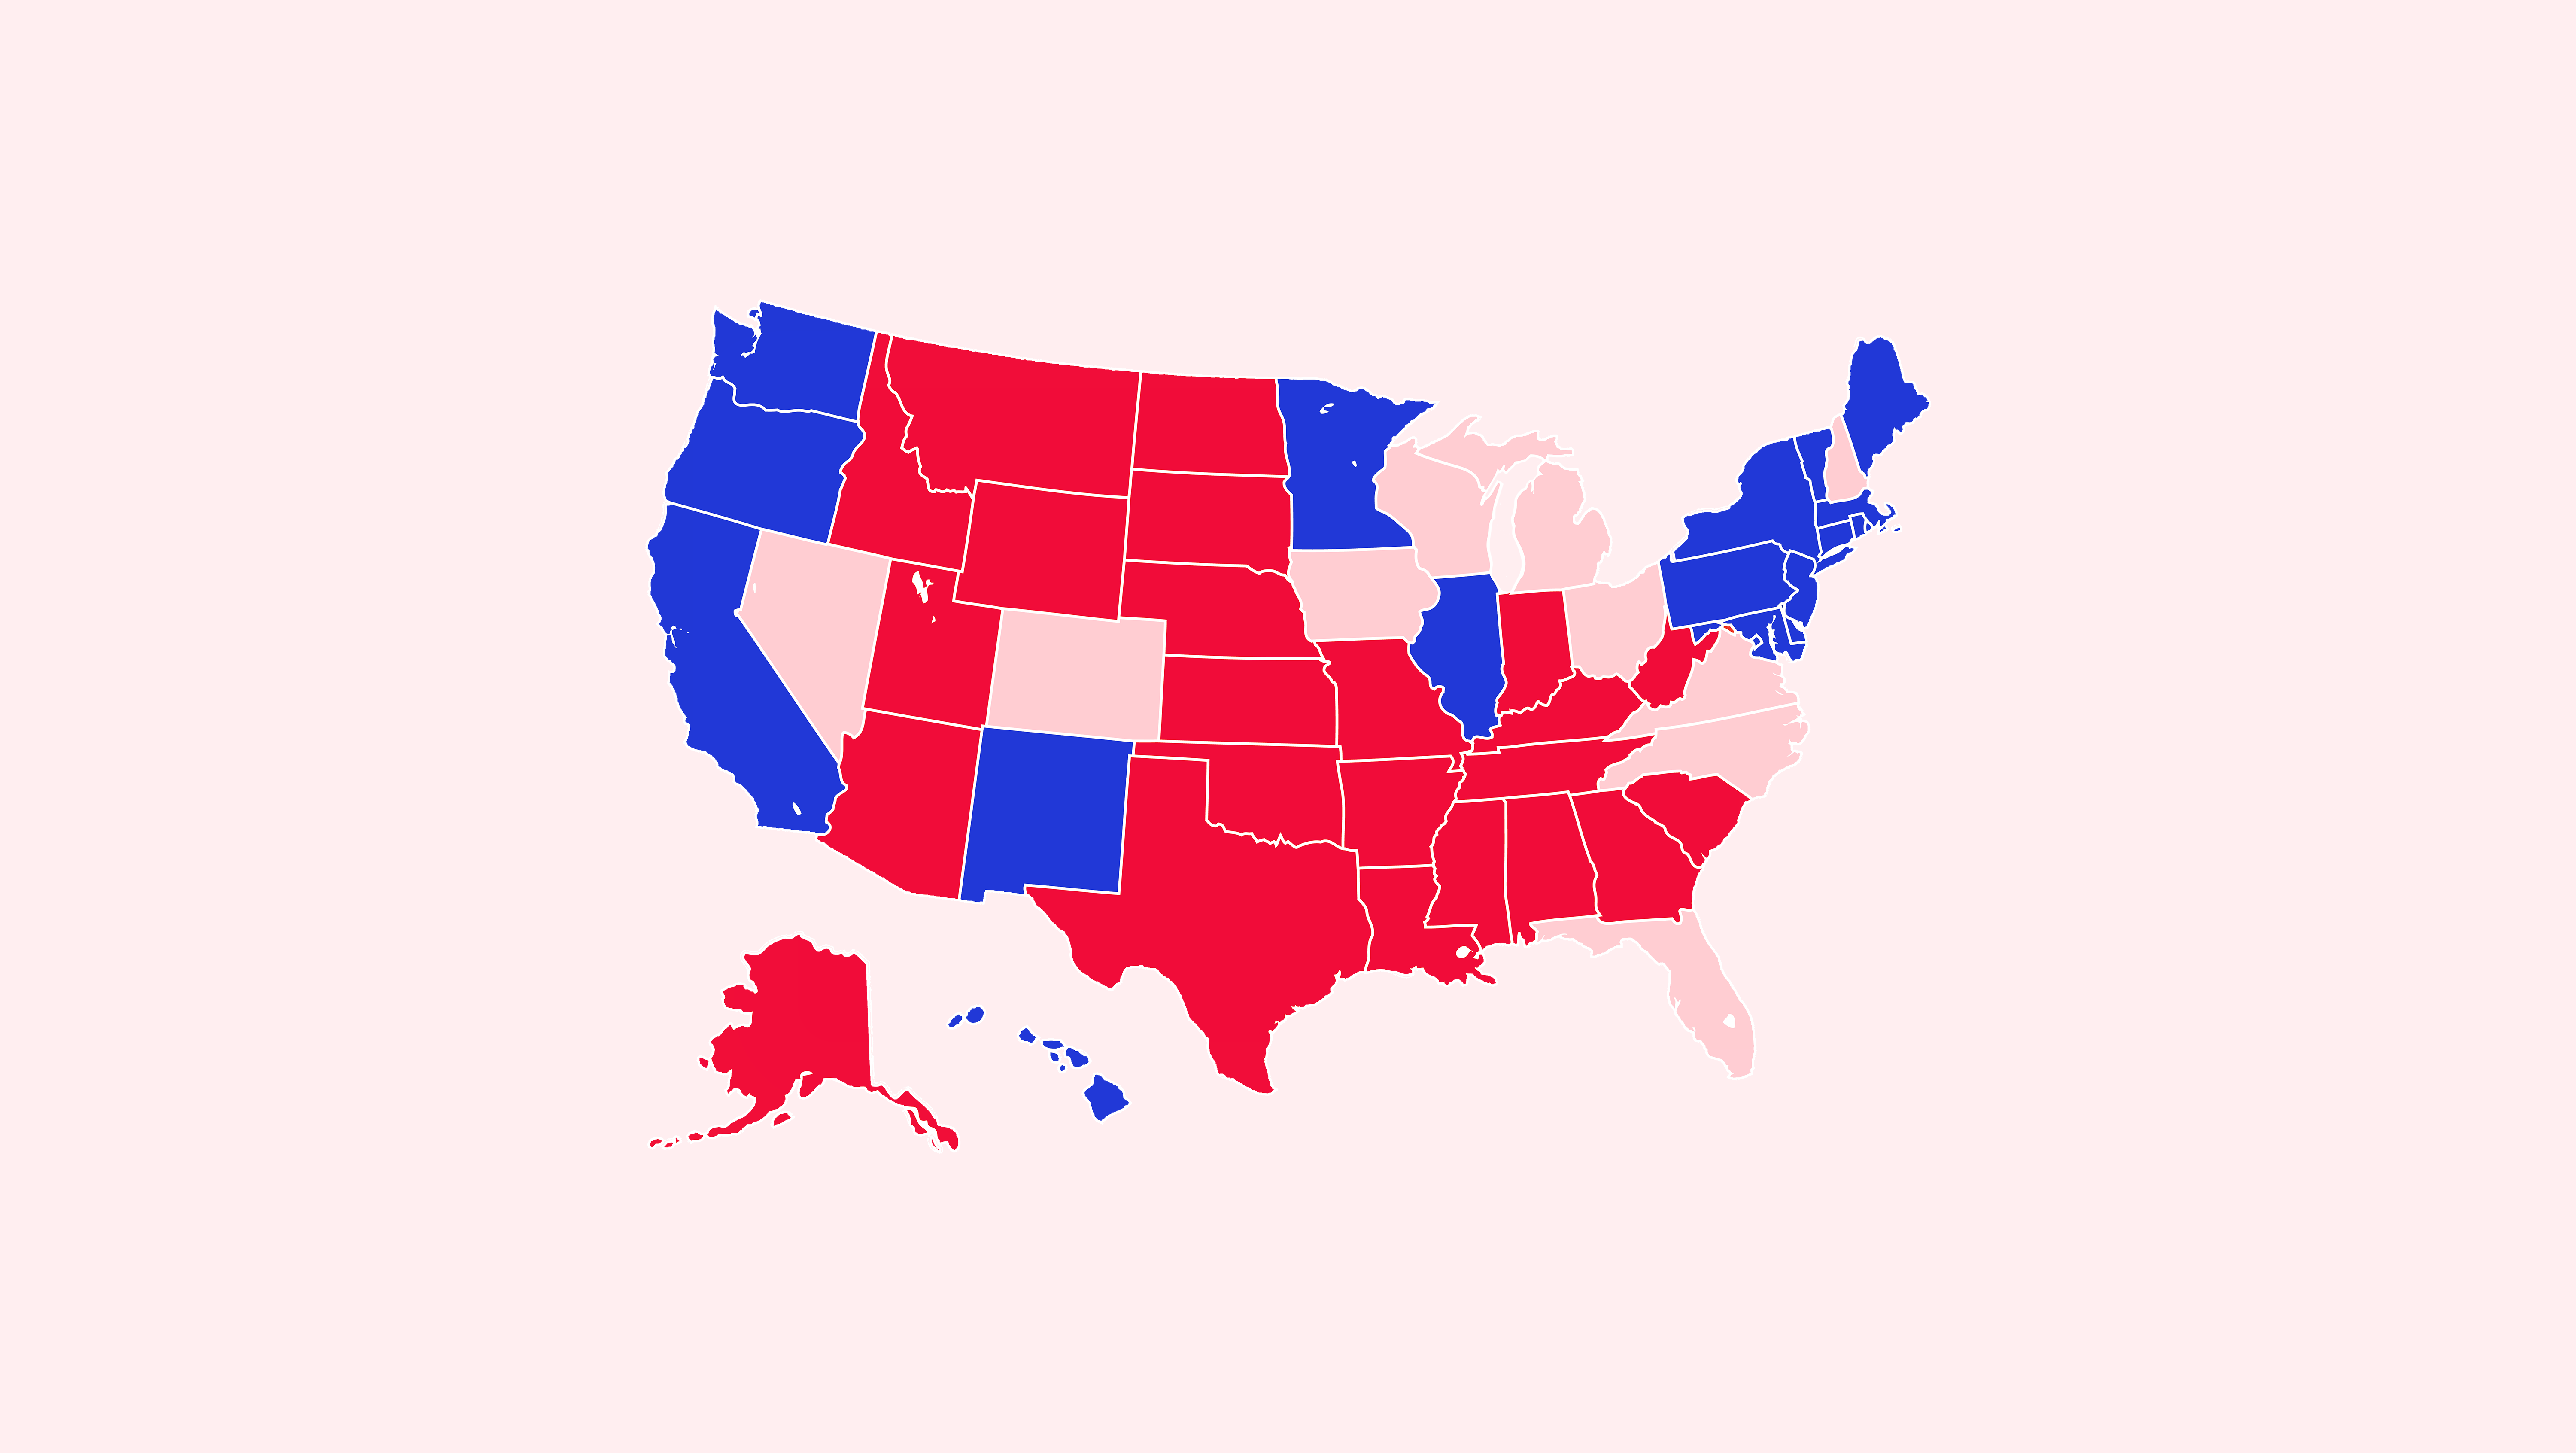
Number of states without a woman currently serving in Congress. (Pennsylvania and South Carolina are on track to elect a woman this year.)
16
Number of female nominees for governor, a record. (Of those, 12 are Democrats and 4 are Republican.)
RELATED STORY
3,379
Number of female nominees for state legislative offices, a record (up from 2,649 in 2016).
$624.7 million
Amount spent by all Democrats running for the U.S. House.
$471.6 million
Amount spent by all Republicans running for the U.S. House.
$368.6 million
Amount spent by all Democrats running for the U.S. Senate.
$233.9 million
Amount spent by all Republicans running for the U.S. Senate.
$24.8 million
Amount spent by incumbent Senator Ted Cruz, a Republican, and his Democratic challenger, Beto O’Rourke, in the race for the U.S. Senate in Texas. The contest is the most expensive race this election cycle.
$55.7 million
Amount contributed by Sheldon Adelson, the Las Vegas casino magnate, and his wife, Miriam. The Adelsons are the biggest spenders of the midterms, and 100 percent of their donations went to Republicans.
$42.2 million
Amount contributed by Tom Steyer, the hedge fund manager turned environmentalist, and his wife, Kathryn Fahr. Steyer and Fahr are the largest Democratic donors this cycle.
32.3 percent vs. 12.9 percent
Portion of money raised by Senate Republican candidates that came from political action committees (or PACs) vs. the portion of money raised by Senate Democratic candidates that came from PACs.
$2.47 million vs. $1.82 million
Amount spent by gun rights groups vs. the amount spent by gun control groups.
$368 million
Amount contributed by residents of California alone; Californians gave more money to campaigns than any other state.
RELATED STORY

33
Number of women vs. women races in the general election.
45 percent
Portion of women running for the U.S. House or Senate who won their primaries (41 winners out of 92 female candidates).
29
Age of the youngest member of the U.S. House of Representatives if Abby Finkenauer wins her race for Iowa’s First Congressional District.

From explainers to essays, cheat sheets to candidate analysis, we're breaking down exactly what you need to know about this year's midterms. Visit Marie Claire's Midterms Guide for more.
Kayla Webley Adler is the Deputy Editor of ELLE magazine. She edits cover stories, profiles, and narrative features on politics, culture, crime, and social trends. Previously, she worked as the Features Director at Marie Claire magazine and as a Staff Writer at TIME magazine.
